Mastering my feed costs
- September 17, 2020
- Le Producteur de Lait Québécois Magazine
Producing milk is all well and good, but at the end of the day there has to be some money left in our pockets! The farms that stand out in this respect are those that have their feed costs under control, which means they have a higher feed margin. Are you among them?
The fact that feed is the biggest expense for dairy farms will come as no surprise. On average, feed costs represent 45% of a dairy operation’s total costs. So keeping an eye on the feed margin is a simple and effective way to monitor a major part of a farm’s overall profit margin. Not surprising then that we keep talking about it!
As long as there are dairy producers unaware of the potential of keeping more money in their pockets, it will be a subject worth talking about.
How to get started
Step 1: Determine the value of your feed margin
If you don’t have this information already, pull out your bills and your calculator. If it seems complicated, know that a number of producers rely on the help of an advisor who is qualified to perform the calculation. The improvement in your profit margin will more than compensate for the advisory fees you’ll pay.
If you’re not afraid of numbers, here are the guidelines for calculating your feed margin:
- Use your milk payment data to calculate your farm earnings.
- Calculate the amount of feed fed to the herd over a one-month period.
- You can use the data from the feeding equipment and/or the records of your concentrate purchases for the month.
- For forages, you can estimate the quantity fed based on an average day.
- Establish your total monthly feed costs by multiplying the price of each feed type by the quantity fed to the animals.
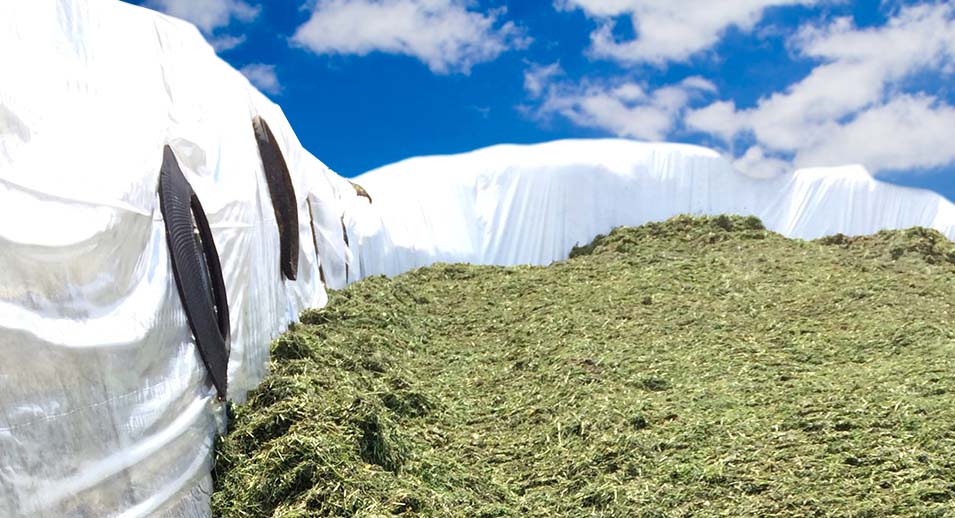
- To simplify the feed margin calculation, a standard production cost is used for the price of forage. In reality, the cost of producing forage varies widely from one farm to the next. Between the best and worst, the cost can literally double. Since production costs represent, on average, 51% of feed costs, it can make a huge difference in what’s left in your pocket at the end of the year! So, in addition to monitoring your margin on regular basis, it’s a good idea to take the time to calculate your forage production costs at the end of the season as well.
- Subtract your feed costs from your net revenue from milk payments to determine the value of the feed margin for the herd.
- Complete the calculation using the type of margin that best indicates your farm’s performance: $/cow, $/kg BF or $/hl.
If you don’t have enough time for a monthly calculation, start with a one-day margin. You can easily calculate how much feed was served during the day, and you can use the last milk pickup to calculate production. The result may not be as reliable as a monthly analysis, but it will serve as an indicator.
Step 2: Compare your margin with that of other similar operations
The reason you want to know the value of your margin is to determine if there is a need for improvement. To do that, it’s helpful to be able to compare your farm with other farms. If the average margin of other operations is higher, it’s likely you could be doing better. If your margin is in the average range but not up to par with the best farms, you could possibly set your target higher.
Lactanet’s database includes a complete set of feed margin data from over 650 herds (2019). The average values are presented in our annual report, Évolution de la production laitière québécoise. The tools that Lactanet advisors use to calculate feed costs also allow you to compare your results against indicators that are updated regularly, using data from all participating farms.
Step 3: Explore possible solutions
Once you’ve identified a need for improvement, you have two options:
Increase your milk value. This means working on milk components. To get the best possible price, the SNF/BF ratio and milk quality are obviously important as well.
- Reduce your feed costs. This leads to a number of questions. Are you serving good quality forage? Are you getting your money’s worth from the concentrates you’re feeding? Is the ration being used to its full potential?…
There are a number of avenues to explore, depending on your situation. It is important to take the time to do a thorough analysis and to ask yourself the right questions to choose the best solutions. The adjustments are often much easier to make than you might think.
Now is a great time to master your feed costs. We’re ready to accompany you through the process. Choose what is right for you; the important thing is to take action. We’re willing to bet that by this time next year, you’ll proudly have your feed costs under control.
What are the top-performing farms doing?
Table 1 presents the results from September 2019 to August 2020 for 631 Holstein herds enrolled on the Lactanet Feed and nutrition option. The farms were divided into five subgroups according to their feed margin per cow. The column on the far right shows the averages for the group as a whole.
Three points stand out:
- The feed margin per kg of butterfat evolves in the same direction as the margin per cow;
- The margin per cow is closely linked to the fat yield per cow;
- The average feed cost per cow shows very little variation between groups, despite differences in productivity.
Producing high yields at low cost is possible
High-productivity herds appear in all the subgroups, which means that high yields don’t guarantee a good margin. This is why it is also important to control your feed costs. Table 1 shows that it is possible to achieve both these goals at the same time. The net result is a lower feed cost per kg of butterfat produced. And, to convince the most skeptical, even the cost of concentrates per kg of butterfat is lower!
To sum up, the pursuit of a better margin per kg of butterfat is no excuse for low productivity, any more than higher productivity justifies high concentrate costs.
Table 1: Technical and economic herd parameters in relation to the feed margin
| Feed margin level (20% strata) | 0-20 | 21-40 | 41-60 | 61-80 | 81-100 | Average |
| Number of herds | 126 | 126 | 127 | 126 | 126 | 631 |
| Number of cows per herd | 62.0 | 64.7 | 76.1 | 81.0 | 91.8 | 75.1 |
| Feed margin ($/cow/year) | 3 739 | 4 620 | 5 051 | 5 471 | 6 131 | 5 002 |
| Milk value ($/cow/year) | 5 993 | 6 971 | 7 460 | 7 884 | 8 550 | 7 372 |
| Feed costs ($/cow/year) | 2 254 | 2 351 | 2 409 | 2 414 | 2 419 | 2 369 |
| Feed margin ($/kg BF) | 11.36 | 12.14 | 12.41 | 12.73 | 13.08 | 12.34 |
| Milk value ($/kg BF) | 18.26 | 18.30 | 18.32 | 18.33 | 18.26 | 18.30 |
| Feed costs ($/kg BF) | 6.90 | 6.17 | 5.91 | 5.61 | 5.18 | 5.95 |
| Concentrate costs ($/kg BF) | 3.56 | 3.13 | 3.02 | 2.88 | 2.70 | 3.06 |
| Milk (kg/cow/year) | 8 145 | 9 420 | 10 062 | 10 593 | 11 436 | 9 931 |
| Fat (kg/cow/year) | 328 | 381 | 407 | 430 | 468 | 403 |
| Fat (%) | 4.04 | 4.05 | 4.05 | 4.04 | 4.04 | 4.04 |
Share