Environmental Footprint of the Dairy Industry
- January 25, 2023
“Sustainability”, a word we have heard countless times across multiple sectors and around the world. But what does it really mean? Sustainability is the capacity to fulfill our needs without compromising the needs of future generations, and it has three pillars: environmental, economic, and social.
For centuries, dairy farmers have proven their awareness and demonstrated their efforts in conserving natural resources, supporting a healthy community, and remaining financially viable for future generations. In recent years, however, science-based targets towards sustainability have been steeper than expected.
Environmental Sustainability
The effects of climate change have become a major concern when it comes to environmental sustainability. More and more countries, communities, organizations, and individuals are starting to ask themselves how they can be more sustainable and contribute to a balanced ecosystem for generations to come. This includes most global dairy industries announcing commitments to reach net-zero greenhouse gas (GHG) emissions by the year 2050, including Dairy Farmers of Canada.
From an environmental standpoint, there are several factors that contribute to sustainability including GHGs, which trap heat in the atmosphere. The main GHGs are carbon dioxide, methane, and nitrous oxide, and their increasing concentration in the atmosphere has been proven to be the primary driver of climate change 1, which has numerous connections to natural cycles and the wealth of land and water resources. The impacts of human-sourced GHG emissions are seen across the country with floods, draughts, forest fires, and intense heat waves, to name a few. With each GHG entering and exiting the atmosphere in a variety of ways, both naturally and via human activities, they each have a different contribution to climate change.
Carbon dioxide makes up 80% of Canada’s GHG emissions and is emitted via fossil fuel combustion and deforestation/land clearing1. Once emitted, carbon dioxide remains in the atmosphere at significant levels for over thousands of years. Methane, on the other hand, remains in the atmosphere for about 12 years and makes up 14% of Canada’s GHG emissions1, but has a higher potency compared to carbon dioxide, as measured through its global warming potential (GWP, Table 1). Natural gas production and distribution, coal mining, livestock farming, and natural wetlands are the main sources of methane emissions in Canada. Nitrous oxide can be emitted via fertilizers application and fossil fuel combustion and makes up roughly 8% of all GHG emissions in Canada1.
|
Greenhouse Gas |
Perturbation Lifetime (Years) | GWP-100 Years (kg CO2-eq/kg of GHG) | GWP-20 Years (kg CO2-eq/kg of GHG) |
| Carbon dioxide, CO2 | Multiple |
• 1 (fossil sourced) |
• 1 (fossil) |
| Methane, CH4 |
11.8 |
• 29.8 (fossil) |
• 82.5 (fossil) |
| Nitrous oxide, N2O |
109 |
273 |
273 |
GWP is an index translating the warming effect following an emission of a unit mass of a GHG, accumulated over a chosen time horizon, relative to that of carbon dioxide (CO2). GWP-100 and GWP-20 are two indices differing by the time horizon chosen, 100 years and 20 years, respectively. GWP-20 for methane is much higher than its GWP-100, since most of the warming effect caused by methane is considered during the 20-year period, as compared to longer-lived GHG like CO2 and N2O, whose warming effect significantly continues after the 20-year horizon. Source: IPCC, 20212; IDF, 20224. Emissions that are considered in the short (biogenic) carbon cycle can be excluded, with GWP=0. Carbon absorbed by animals and crops (as CO2) is carbon-neutral because it is re-released quickly as it is metabolized again into CO2 and subsequently exhaled, or released as biomass (i.e. manure or crop residues) before being degraded. However, carbon in the short cycle that is transformed into biogenic methane, e.g. enteric methane, should be accounted for, with a reduced GWP value that accounts for the slow decay of biogenic methane back into biogenic CO2 in the atmosphere occurring over a longer cycle.
On-Farm Emissions
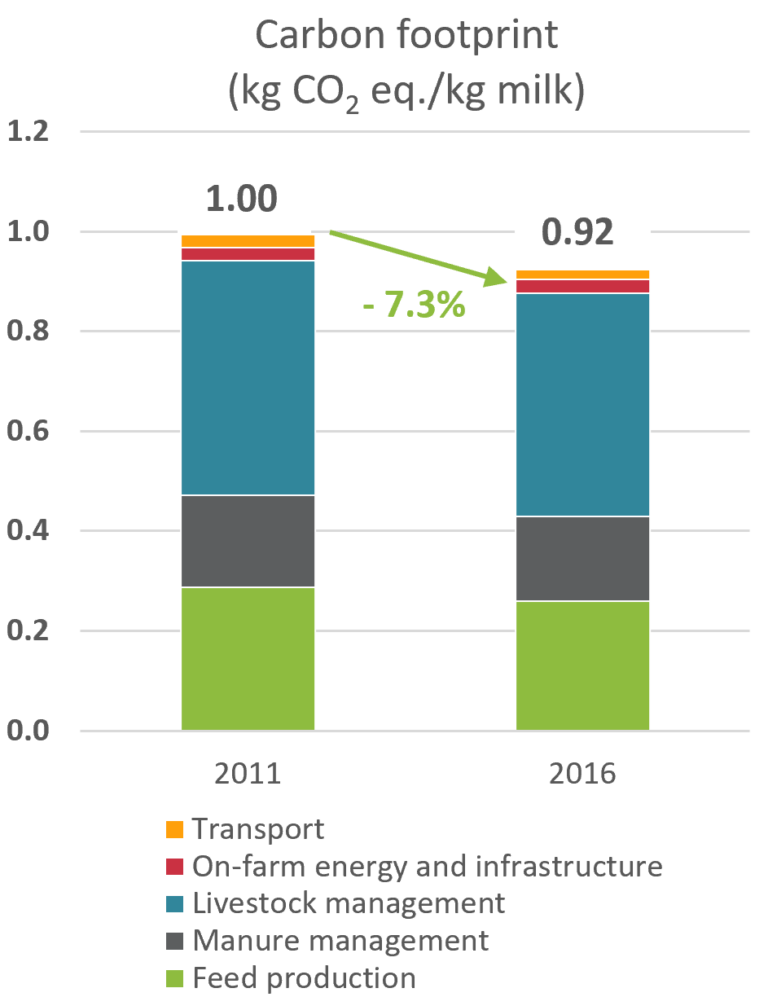
When it comes to agriculture’s role in GHG emissions, the agriculture sector accounted for 8.2% of Canada’s GHG emissions in 20201. This includes emissions from enteric fermentation, manure management, agricultural soils, and field burning of agricultural residues. If we look at the Canadian dairy industry, it has one of the lowest environmental footprints in the world representing less than 1.3% of Canada’s GHG emissions, 0.02% of Southern Canada’s freshwater supply, and 2.9% of Canada’s total agricultural land use3. For GHG emissions specifically, the carbon footprint of milk in 2016 amounted to 0.92 kg of CO2-eq for one kilogram of milk produced and transported to the processing plant. These emissions come from:
- 48% from livestock management (i.e. enteric fermentation),
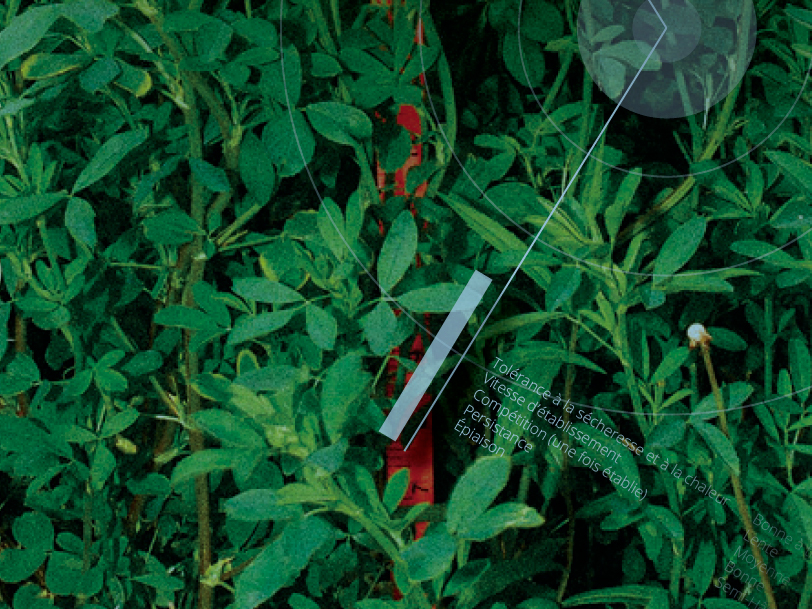
- 28% from feed production,
- 18% from manure management, and
- 6% from transport and on-farm buildings energy and infrastructure3.
What is a carbon footprint?
(adapted from IDF, 20224)
A carbon footprint is an evaluation of all GHG emission inputs (e.g. CO2 sequestration) and outputs (emissions) for a specific product or production system, such as a dairy farm, a dairy processing plant or the entire dairy production system, across its life cycle. The impact of all emitted GHG is generally calculated using the GWPs, such as those presented in Table 1.
For example, the carbon footprint presented in Figure 1 is obtained by calculating and summing all GHGs emitted per kilogram of milk emitted during all life cycle stages of the product from beginning (e.g., from the production of resources like diesel or mineral fertilizers) to end (e.g., transportation of milk to the processing plant), and also includes those related to the management of any waste generated. In the end, these GHG emissions are reported as kg of CO2 equivalent per kg milk (using GWP-100).
Figure 1. Relative contribution of the life cycle stages to the average CARBON footprint of producing one kilogram of Canadian milk3
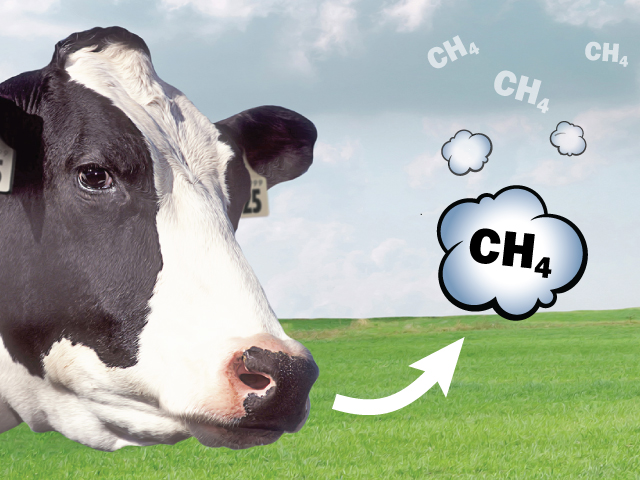
The largest contributor to the carbon footprint of milk occurs during the cow’s digestion process. A process called enteric fermentation breaks down carbohydrates from the feed cows eat into glucose and volatile fatty acids, which are then used for energy and protein production. However, enteric fermentation also produces methane that is emitted when a cow burps. Enteric methane is the largest contributor to agriculture’s carbon footprint. In Canada, the average methane produced per cow is approximately 150 kg per lactation. These methane emissions not only contribute to the dairy industry’s carbon footprint, but also represents an energy loss to the animal. Methane is also emitted during manure removal from the barn, storage, and especially during its decomposition under anaerobic (low oxygen) conditions. Nitrous oxide also arises from manure management; however, its main source is on the field during the production and processing of feed including fertilizer application and the decomposition of crop residues.
Mitigation Strategies
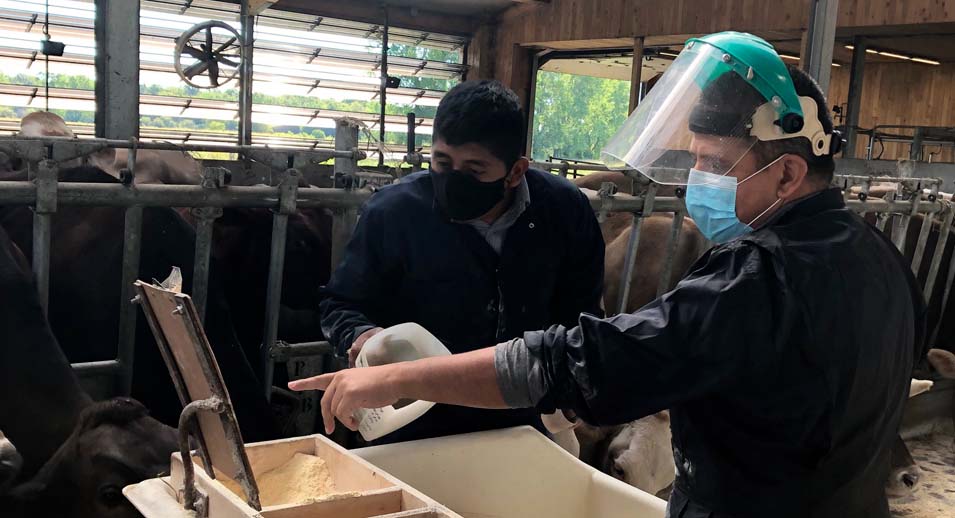
Despite the relatively small contribution of the dairy sector to Canada’s GHG emissions, dairy farmers have found unique mitigation strategies from improvements in nutrition, genetics, housing, and crop production to reduce emissions and, in the end, their carbon footprint. These include great strides in nutrient digestibility through modifications in dietary compositions, and improved efficiency resulting in the production of the same amount of milk with fewer animals. Canadian dairy farmers have already reduced the carbon footprint of a litre of milk by 25% since 19901.
In the years to come, Lactanet is committed to being a leader in sustainability. By providing new tools, including genetic evaluations for Methane Efficiency, Lactanet will collaborate with industry partners to help the dairy industry not only be more environmentally sustainable but also contribute to its productivity and efficiency.
Sources:
- Environment and Climate Change Canada. 2022. National Inventory Report 1990-2020: Greenhouse Gas Sources and Sinks in Canada. https://publications.gc.ca/collections/collection_2022/eccc/En81-4-2020-1-eng.pdf
- IPCC, 2021: Climate Change 2021: The Physical Science Basis. Contribution of Working Group I to the Sixth Assessment Report of the Intergovernmental Panel on Climate Change [Masson-Delmotte, V., P. Zhai, A. Pirani, S.L. Connors, C. Péan, S. Berger, N. Caud, Y. Chen, L. Goldfarb, M.I. Gomis, M. Huang, K. Leitzell, E. Lonnoy, J.B.R. Matthews, T.K. Maycock, T. Waterfield, O. Yelekçi, R. Yu, and B. Zhou (eds.)]. Cambridge University Press, Cambridge, United Kingdom and New York, NY, USA, 2391 pp. doi:10.1017/9781009157896.
- Groupe AGEGO. 2018. Environmental life cycle assessment of Canadian milk production. 2016 data and results update. Executive Summary.
https://www.dairyfarmers.ca/content/download/6327/56092/version/2/file/LCA__ExecutiveSummary.pdf. Accessed April 26, 2021. - IDF, 2022. The IDF global Carbon Footprint standard for the dairy sector. In: Bulletin of the IDF No 520/2022. International Dairy Federation (ed.), Brussels.
Share


By Dominique Maxime, Dairy Production Expert in Sustainability and Environment