Producing cost-effective milk in 2021
- Le Producteur de Lait Québécois Magazine
The new policy for the payment of milk components based on the SNF/BF ratio will come into effect on August 1, 2021. To maximize milk production value, herd managers will need to maintain a butterfat content above 4.1 kg/hl. In terms of management, feeding and genetics, what are the strategies that can help achieve this goal?
SNF/BF ratio
Keep in mind that the purpose of this new policy is to better align the composition of milk produced on farms with market needs. It also aims at maintaining equity among producers in the context of an oversupply of solids non-fat.
Although the new payment policy will certainly improve farm gate milk prices when the SNF/BF ratio is close to 2.0, there will be little difference in price between 2.0 and 2.3. The advantage of producing milk with a ratio close to 2.3 will likely be lost under this new system. Since the price will vary little, it will be wiser to aim for a lower ratio to avoid ending up with a ratio over 2.3, where there will be no payment for solids non-fat. Figure 1 models the change in pricing under the new milk payment system, as of August 1, 2021. International and American SNF prices may influence the Canadian model as well, and the new Canada – United States – Mexico Agreement puts a cap on solids non-fat production. Therefore, the model may change over time depending on these factors. Keep an eye out for updates from the PLQ over the next few months.
Butterfat production is clearly becoming more important, and the market is driving this trend. To maximize the value of the milk produced, it will be critical to maintain a butterfat content above 4.1 kg/hl in order to maintain a SNG/BF ratio below the 2.3 threshold.
Figure 1. Modelling of the new calculation method for milk prices based on the SNF/BF ratio

A key strategy – genetic selection for fat
Since butterfat content is a trait of high heritability (about 50%), genetic selection will be crucial to improve performance and obtain a higher milk price.
Experts say that genetic selection should focus on improving an overall selection index, such as the Lifetime Profit Index (LPI) or Pro$. The goal is to breed profitable cows, cows that efficiently yield high volumes of butterfat and protein throughout their productive lives. However, when reviewing selection objectives, it will be necessary to analyze genetics according to specific criteria, such as the fat content and fat yield of the herd.
Genetic Herd Inventory Report
The Genetic Herd Inventory report is an excellent tool for assessing the situation in a herd as it lists herd averages for active cows and heifers. The report also indicates the herd ranking, expressed as a percentile rank (% RK), for key selection traits, such as milk, butterfat and protein yields.
The graph below shows two herds with profiles that are very different.
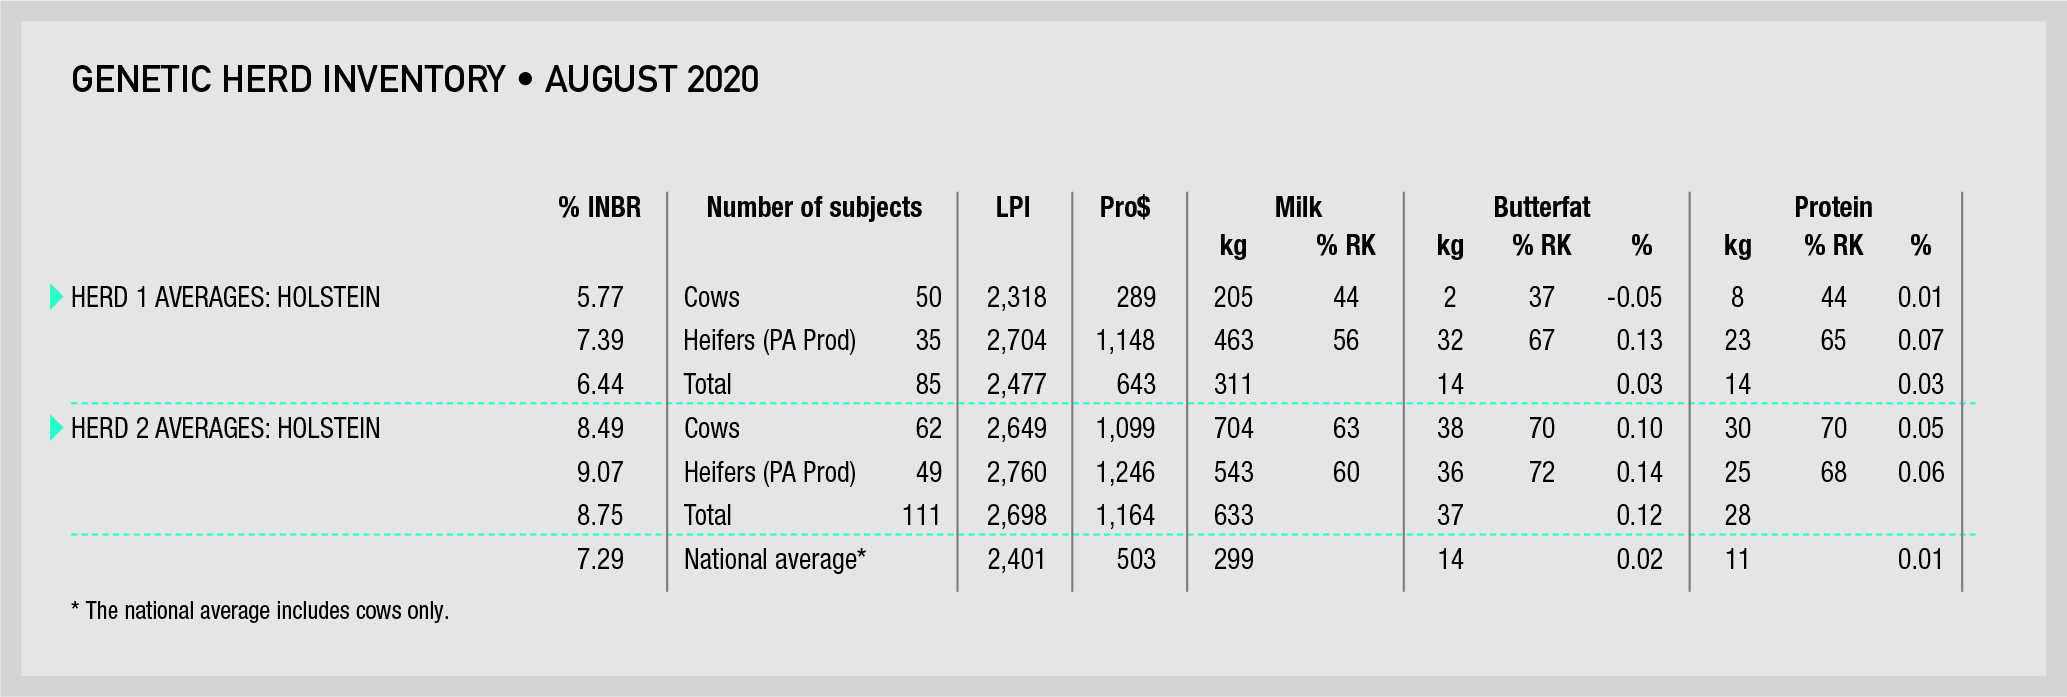
The cows in the first herd have an average index of +2 kg of fat and -0.05%. With a percentile rank of 37 for butterfat, the herd is below average for this trait.
The cows in the second herd have an index of +38 kg of fat and +0.10%. With a percentile rank of 70 for fat yield, this herd is above average for fat.
Genetics don’t tell the whole story, of course, but it will be much easier for the second herd to achieve an average bulk tank fat test of 4.10 kg/hl for 12 months.
With regard to the first herd, it is important to note that selection has increasingly focused on the top sires and top heifers for fat. Hence, the indexes for the heifers in these herds are comparable. Unlike improved herd management and feeding, genetic selection rarely provides immediate results. However, with high heritability criteria such as butterfat, you can see the impact on the herd starting with the next generation. It makes sense to act now to reap the benefits in the future.
Fat test – often a matter of balance
All producers aim for a good fat test result, but multiple factors are involved in achieving that goal. Once genetics, breed, parity and seasonality have been considered, two important elements are left to explore: feeding and herd management.
The butterfat levels will decrease when an imbalance can’t be offset by improving another factor. For instance, let’s consider a situation where the ration is slightly high in starch, without too many unsaturated fats (RUFAL) or ionophores, to which only buffer elements are added. No sorting is observed at the feeder and all management factors are normal. Under these conditions, the fat test will most likely not be affected. However, if there is an imbalance, such as a non-homogeneous ration and cows sorting, you can expect a decrease in fat levels.

Each farm has its own balance
Every farm has its own management conditions and feeding program, which come with benefits and drawbacks. Since most farms produce good milk components, it is safe to assume that all the criteria are balanced. The amount of unsaturated fat (RUFAL) in the ration is a good example of how that balance can differ among farms. Two kilograms of untreated soybeans in the ration may cause fat levels to drop in one herd but not in another. The farm that is able to maintain its fat levels feeds good-quality forages, the ration contains less starch, the chop length of its silages is ideal, and effective fibre is doing its job. Feed bunk management is adequate, some of the feed remains uneaten every morning and cows are not sorting the ration. The ruminal pH is stable and the balance is maintained. The quantity of unsaturated fat is indeed a risk factor, but a number of elements in this example are able to compensate for that and maintain a balance for the herd.
Hence, if one element of management or feeding disrupts the balance, and it happens that we are unable to change the situation, we have to consider changing the other elements to find a new balance.
SNF/BF ration during the summer
Heat and thermal stress are known to influence milk components, but what is their impact on the ratio? Figure 2 presents the average provincial values per month for 2019 and 2020.
Figure 2. Variation in the SNF/BF ratio in relation to the months of the year

* Data for December 2020 were not available at the time of writing this article.
As can be seen in the graph, the provincial SNF/BF ratio varies depending on the season. The increase in the ratio is largely attributable to the drop in the fat test results over the summer months. As well, the summer was much hotter in 2020 than in 2019. The variation in the ratio increased by 0.05 in 2019 and 0.08 in 2020. It is thus advisable to maintain a ratio between 2.20 and 2.25 to avoid going over the 2.3 threshold during the summer. Likewise, any efforts to improve ventilation in the barn will contribute to keeping the ratio down during the summer months.
As you can see, it is possible to implement many herd management strategies to maintain a fat test of 4.1 kg/hl throughout the year. Given the interaction among the factors at play, it is a good idea to view the situation from different angles to identify opportunities for improvement.