How to Increase the Bottom-Line Through Cow Comfort?
- December 16, 2022
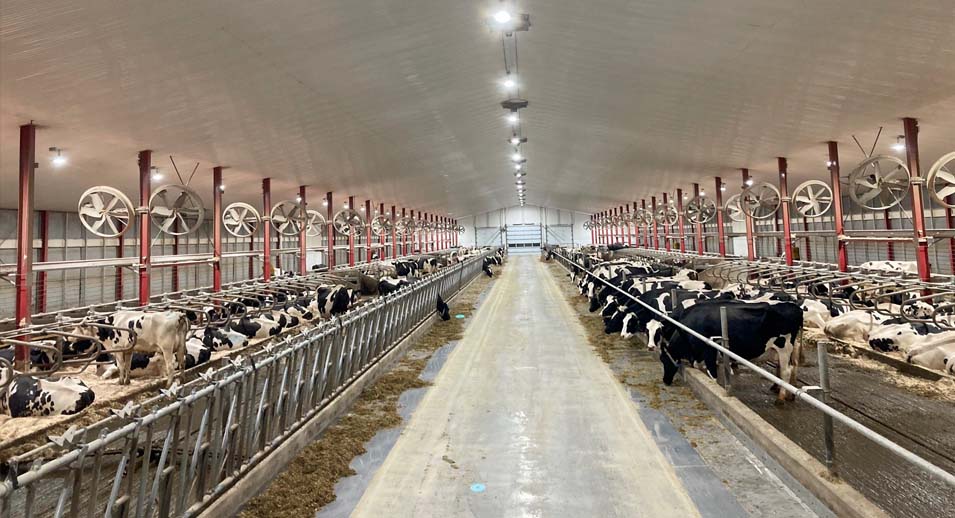
We know there can be a significant return on investment in getting cows to eat more. Aspects like feedbunk space, number of feed deliveries and feed pushups have a significant impact on productivity. Investments on cooling cows also pay off as heat-stressed cattle leads to reduced milk production. We also know that overcrowding reduces milk production and welfare. But what other cow comfort indicators translate into financial benefits?
Looking at the Big Picture
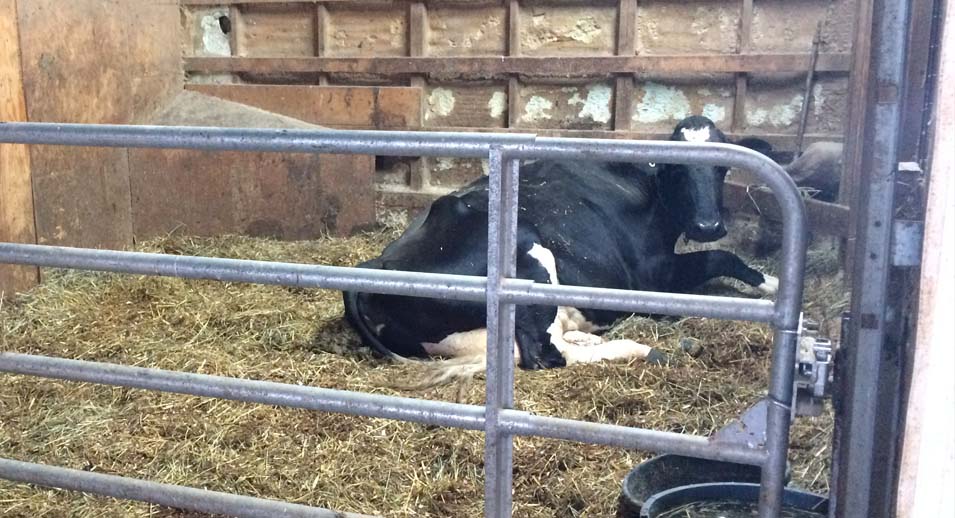
When thinking about the economics of cow comfort, we must address a combination of factors. A series of 2019 Canadian studies showed the impact of comfort on a dairy producer’s wallet. We know that poor cow comfort is a primary driver of lameness and hoof lesions. It goes without saying that there is a substantial economic loss resulting from lameness related to loss of milk production, increased risk of death, of culling, of reproduction issues, treatment cost etc. The more cases of lameness, the more severe they are and the longer they last, then the higher the cost.
The economic loss associated with lameness and leg injuries will vary greatly among herds depending on the:
- Number of current cases
- Number of new cases
- Severity of cases
- Duration of cases
Which Cow Comfort Indicators Translate into Financial Benefits?
In one of the Canadian studies (Villetaz Robichaud et al., 20191) focused on freestall herds, the average milk production per cow/year was about 9,500 kg. Researchers saw that:
- A 1% increase in a herd’s lameness prevalence represented a loss of around 12 kg of milk/cow/year. If we put that
- A herd with 150 milking cows in which 30% of cows are lame will produce 26,000 kg LESS milk in a year compared to a herd where only 15% of cows are lame.
- In addition, the same herd with 30% of lameness will have around a 10% higher culling rate than the herd with 15% of lameness.
Let’s now look at leg injuries. When cows get up or lie down, they place weight on their knees. Knee injuries may result from hard or abrasive lying surfaces or from slippery floors. It turns out that preventing knee injuries pays off:
- A 1% increase in a herd’s knee injury prevalence represented a loss of over 7 kg of milk/cow/year. Using the previous example, this roughly means that:
- A herd with 150 milking cows in which 30% of cows have injuries in their knees will produce 16,600 kg LESS milk in a year compared to a herd where only 15% of cows have injuries on their knees.
- When it comes to profit margin, calculated exclusively over the replacement costs, the same theoretical herd will have a lower yearly economic margin over replacement costs of about $11,500 compared to a herd with 15% prevalence of knee injuries.
The Economic Impact of a Comfortable Lying Surface
Dryness
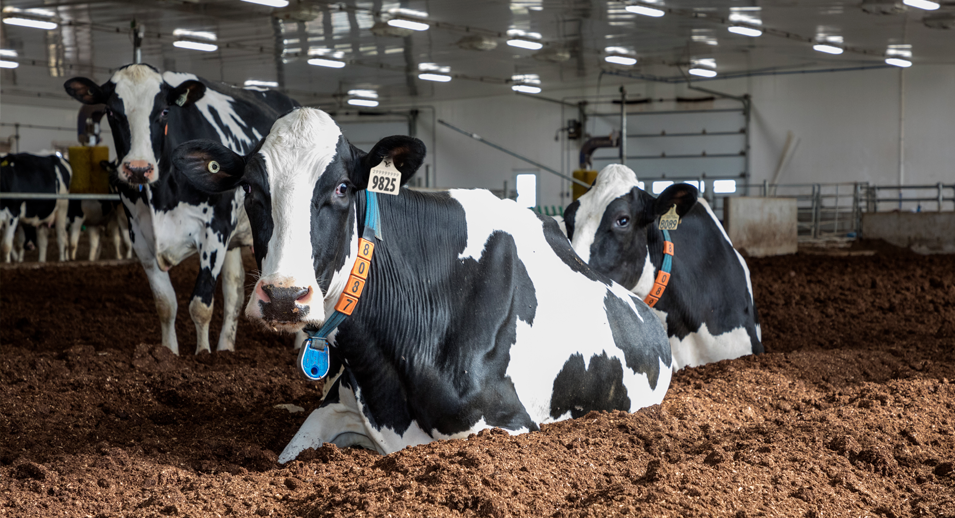
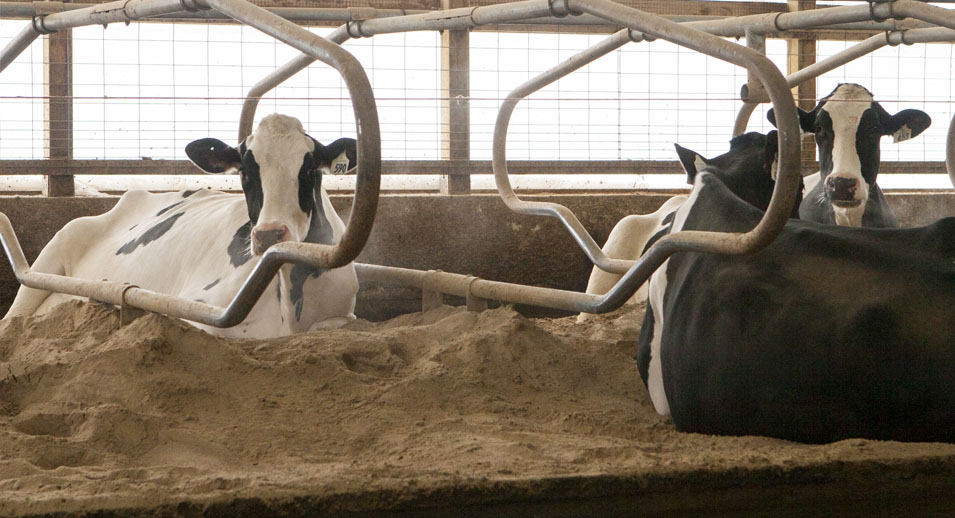
Cows DO NOT like to lie down on wet surfaces. If they have no choice, they may spend 5-7 hrs/day less lying down on wet surfaces compared with drier ones (Schütz et al., 2019).
When it comes to the economic benefit of maintaining dry stalls, here’s what the study showed:
- A 1% increase in the proportion of stalls with dry bedding represented an increase of about 10 kg of milk/cow/year, meaning roughly that:
- A herd with 150 milking cows that maintains 80% of the stalls with dry bedding will produce around 44,500 kg MORE milk and $29,000 more in a year compared to a herd that maintains only 50% of the stalls with dry bedding.
Hygiene
Villetaz Robichaud et al. also found that cow cleanliness has an impact on milk production:
- A 1% increase in a herd’s prevalence of cows with dirty flanks represented a loss of over 27 kg of milk/cow/year, meaning that:
- A herd with 150 milking cows of which 30% have dirty flanks will produce 80,800 kg LESS milk in a year compared with a herd with 10% of cows with dirty flanks.
Design
Another critical feature of the lying surface is the space provided. The percent of cows that fit in the average bed length is an indicator that stalls are properly sized to ensure cow comfort. In the Canadian study1, the herds that provided longer stalls had greater longevity.
Main cow comfort indicators that translate into financial benefits:
- Decrease lameness prevalence
- Decrease prevalence of knee injuries
- Optimise dryness, cleanliness, and design of lying surfaces
Profitability + Comfort + Productivity = Great Work Environment
The evidence so far suggests that you get more bang for your buck focusing on keeping lameness and leg injuries to a minimum along with adopting management practices that intent to improve the dryness, hygiene, and design of lying surfaces.
To wrap up, when thinking about cow comfort, we focus not on a single but on a combination of different aspects that can provide the highest financial return and that promote a healthy work environment for both the animals and the workers.
References:
1 Villettaz Robichaud M., Rushen J., de Passillé A. M., Vasseur E., Orsel K. et Pellerin D. (mai 2019). Associations between on-farm animal welfare indicators and productivity and profi tability on Canadian dairies: I. On freestall farms. Journal of Dairy Science, vol. 102, no 5, p. 4341-4351.
2 Schütz K. E., Cave V. M., Cox N. R., Huddart F. J. et Tucker C. B. (février 2019). Effects of 3 surface types on dairy cattle behavior, preference, and hygiene. Journal of Dairy Science, vol. 102, no 2, p. 1530-1541.
