The Life Cycle of a Dairy Operation: A Wheel That Turns!
- December 10, 2021
- Le Producteur de Lait Québécois Magazine
Whether in magazines, conferences or training sessions, we continue to hear about high-performance farming operations, often associated with high profitability. But what does that mean exactly? Is productivity the sole factor that determines if a farm will stand the test of time? Perhaps a broader perspective would be helpful to see the bigger picture and that’s just what Lactanet’s new Sustainability Index allows you to do. It is a valuable tool that identifies the main factors that can influence and provide traction to understand the life cycle of your herd.
Life Cycle of a Dairy Herd
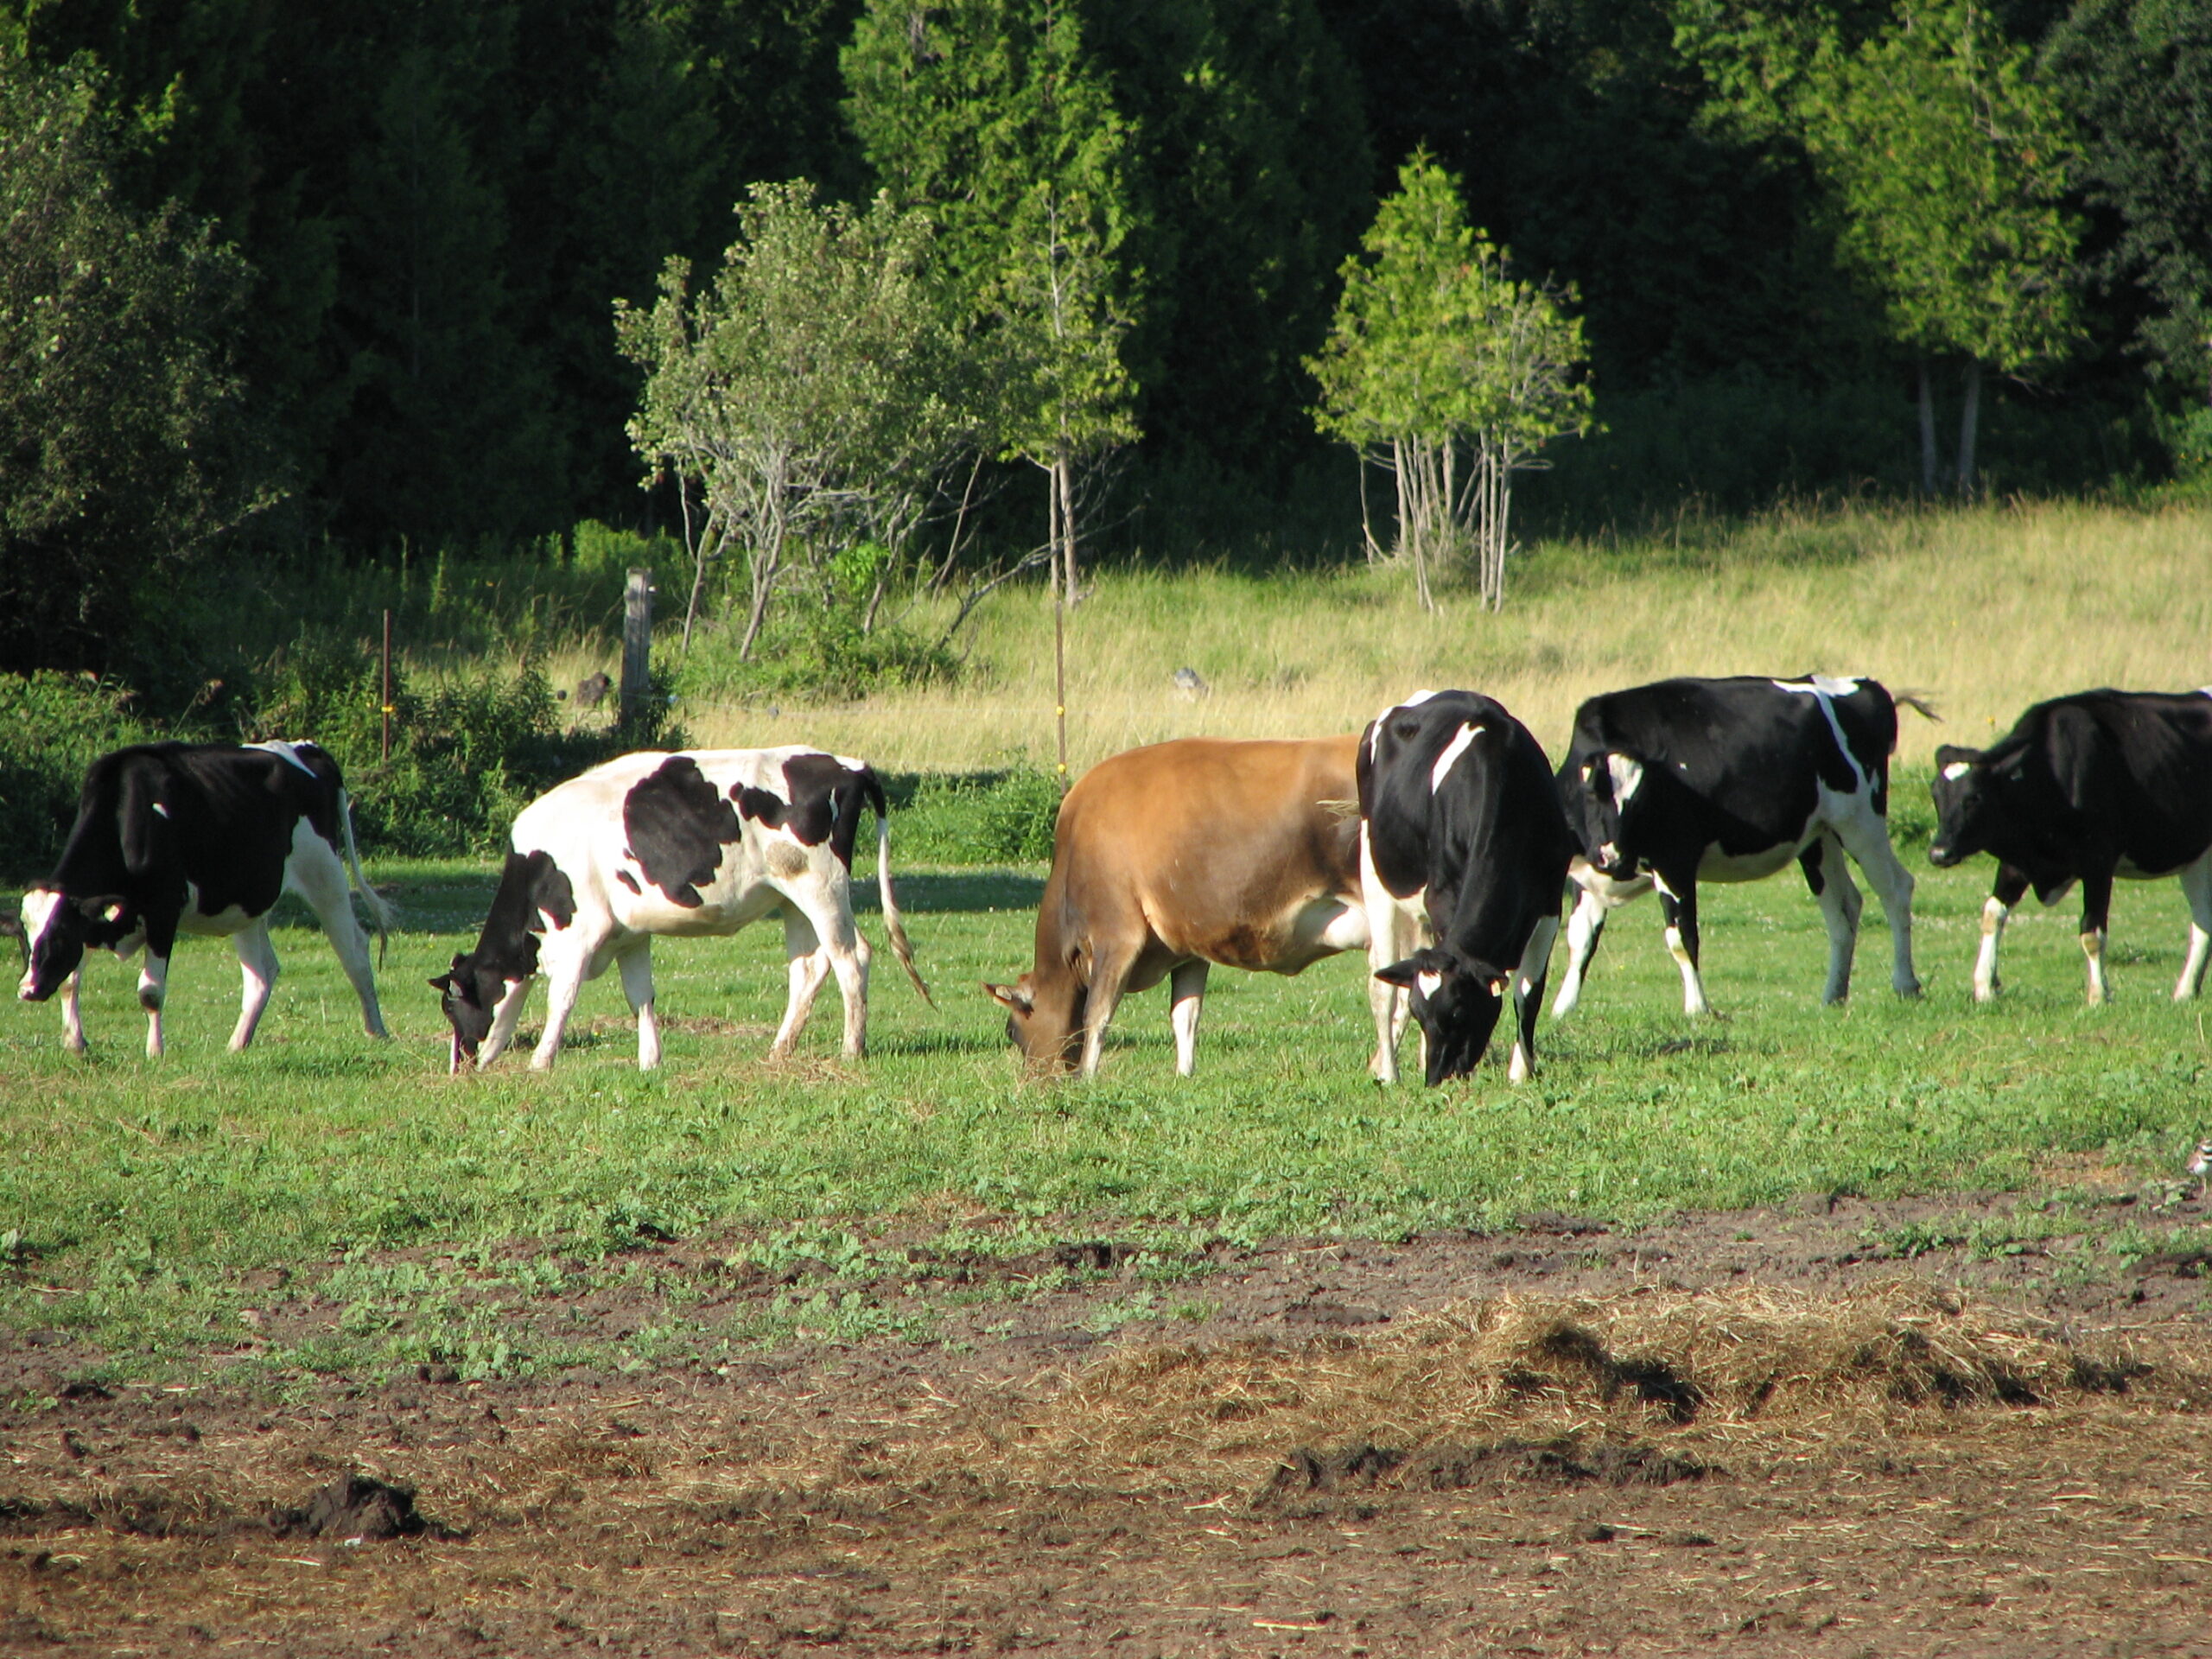
A dairy farm is indeed a wheel that turns. Calves are born and some will thrive more than others and enter into the life cycle of your herd. At the hub of that wheel are productive animals that support the livelihood of the entire farm team. Eventually, there comes a time when every animal leaves the herd, be it culling, voluntary or not. At first glance, it all seems quite simple, but when you take a closer look, factors like management, environment, feeding, genetics, labour, and quota all influence the rate at which the wheel – the life cycle of your herd – turns. What if it were possible to estimate the wheel’s speed to foresee the health and prosperity of your business?
Sustainability Index
At Lactanet, a group of experts collected milk recording data from farms and identified several indicators to develop a tool called the Sustainability Index. Criteria in 10 areas was grouped in four categories: longevity and culling, feeding and production, heifer calves and yearling heifers, and lastly, health. Expressed as a percentile ranking, the Sustainability Index helps you compare your operation with provincial and national averages. By doing so, you are able to quickly identify your operation’s strong points, as well as areas that need improvement. A concrete plan can reduce the speed of the wheel and improve the life cycle of your herd.
Sustainability Index Under the Microscope
Longevity and culling
- % of cows in 3rd lactation or greater
- % of involuntary culling
- % of cow mortality
Feeding and production
- % of cows with urea nitrogen < 5 and/or > 18 mg/dl milk
- Management Score *
- Transition Cow Index (kg of milk)
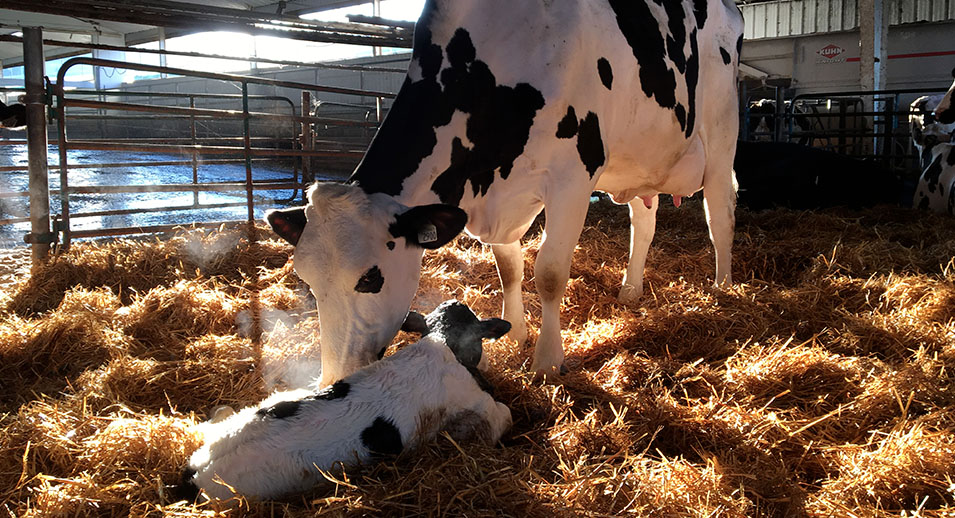
Heifer calves and yearling heifers
- % of calf mortality (0-24 h)
- Age at first calving (months)
Health
- % of cows with high beta-hydroxybutyrate (BHB) levels (> 0.20 mmole/l milk)
- % of cows with high somatic cell counts (SCC) > 200 000 cells/ml milk)
* The Management Score corresponds to a value (positive or negative) of kg of corrected milk fat and protein for the herd. It represents the difference between production based on the herd’s genetic potential and the actual production of the cows that were in the herd at the time the Index was calculated.
Which Herds Have the Best Sustainability Index?
Are you wondering what distinguishes the top Sustainability Index herds from the others? So were we! Last August, the Sustainability Index was calculated for all herds in Quebec. Here’s what we learned about the top Sustainability Index herds (percentile ranking 90 and over):
- Productivity per cow is higher, 11 023 kg milk/year
- 45.7% of cows are in their 3rd lactation and greater
- Fewer cows are culled (32.4% cull rate)
- Their calving interval is 395 days
- Their average SCC is 137 000
- Their milk value is $780/cow/year higher than the average ($8212/cow/year)
Share