Pro$: Canada’s Profit-Based Genetic Selection Index – April 2024 Update
- March 21, 2024
Annual Update to Pro$
Pro$ is the Canadian economic selection index that maximizes genetic response for cow lifetime profitability. Selection for Pro$ will lead to a herd that excels for production, is long-lasting with good functional conformation, and has a greater resistance to various diseases. If your herd generates essentially all its revenue from the sale of milk and its components, Pro$ is designed to be your primary selection index tool.
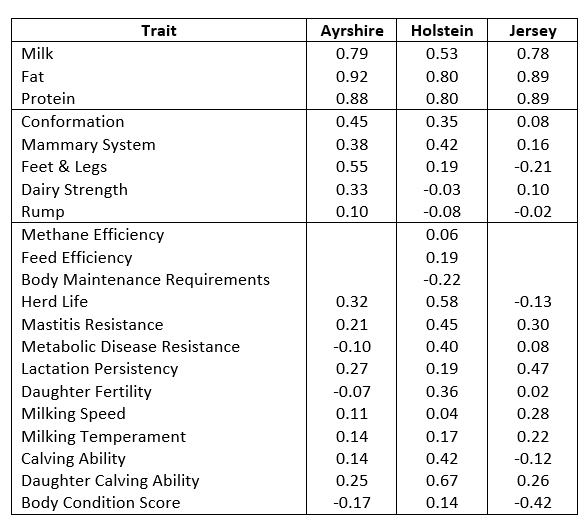
The formula details for Pro$ are not published so as to focus on the expected response per trait rather than the list of traits included in the formula and their relative weight. The correlation of Pro$ with proofs for the key traits in each breed are shown below.
Pro$ is expressed as an animal’s average daughter profit deviated from the national average daughter profit. With each Pro$ update and new economic values, daughter profits will change to some extent, resulting in changes in published Pro$ values. Combined with the April 2024 genetic base update, the top 100 proven Pro$ sires from December see their Pro$ decrease by an average of 293, 645, and 479 dollars for the Ayrshire, Holstein, and Jersey breeds, respectively.
The table below provides some key statistics related to the cows with actual profit data used to develop the Pro$ formula in each breed for 2024. Changes in the pricing of milk and its components affect each cow’s revenue and other economic values, including feed and maintenance costs, affect expenses for lactating and dry cows as well as the rearing costs to first lactation. To reflect a measure of lifetime profitability, the Pro$ calculations consider each cow’s revenue and expenses accumulated to 6 years of age or disposal if removed from the herd earlier.
Breed | Birth Years | Number of Cows | Average Up to 6 Years of Age or Disposal | ||||
Age at First Calving (d) | Rearing Cost(to 1st calving) | Total Milk (kg) | Total Fat (kg) | Total Protein (kg) | |||
Ayrshire | 2007-17 | 39,273 | 824 | $4,244 | 18,413 | 769 | 628 |
Holstein | 2011-17 | 1,023,054 | 771 | $3,985 | 25,321 | 1,012 | 833 |
Jersey | 2007-17 | 51,924 | 778 | $3,972 | 17,204 | 870 | 661 |