High variability between herds
American studies have reported that herds with higher de novo levels have shown better performances. Quebec data are, to some extent, consistent with that finding, showing a clear relationship between de novo fatty acids and bulk tank fat or protein (Figure 1). In fact, for every tenth of a unit increase in de novo fatty acids (0.10), fat content increases by two tenths (0.20). The link with true protein is also clear: for every 0.10 increase on the de novo scale, true protein increases by 0.12 units.
Figure 1: Each 0.1% increase in de novo fatty acids corresponds to a 0.2% increase in fat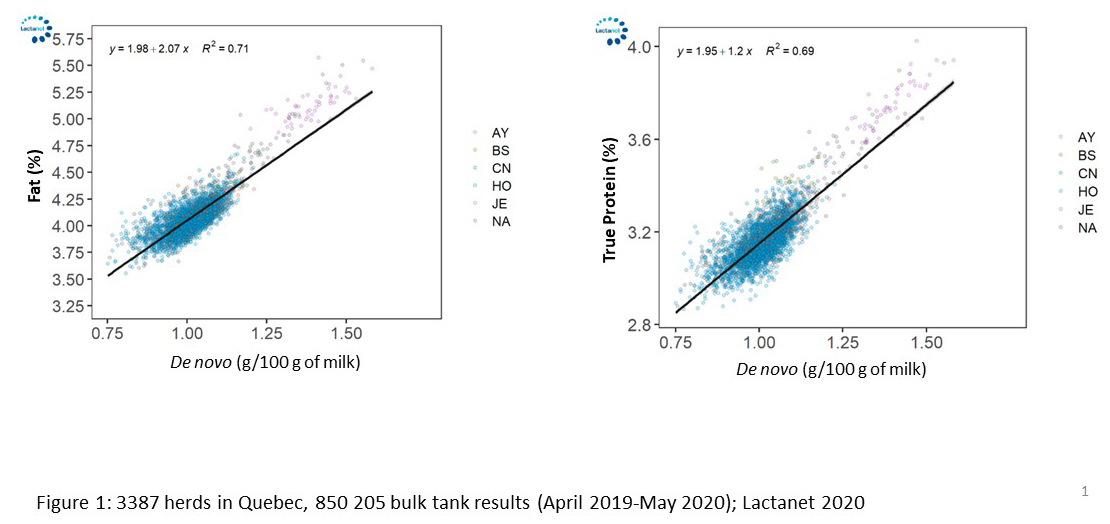
Our data for several thousand Quebec herds show, however, that the fatty acid profiles vary widely between farms. Breed is among the factors that have the greatest impact on the fatty acid. As shown in Figure 2, the levels of the different groups of fatty acids are higher in milk from predominantly Jersey herds, especially de novo and mixed fatty acids. More specifically, the de novo fatty acid content for Jersey herds is about 1.3 g/100 g of milk, as compared to around 1.05 g/100 g of milk for Holstein herds, with the other breeds falling in between. It should be noted that the variability between herds is high for all breeds, with the differences largely attributable to ration composition, feeding behaviour and herd management.
Figure 2: Breed influences the fatty acid profiles of Quebec herds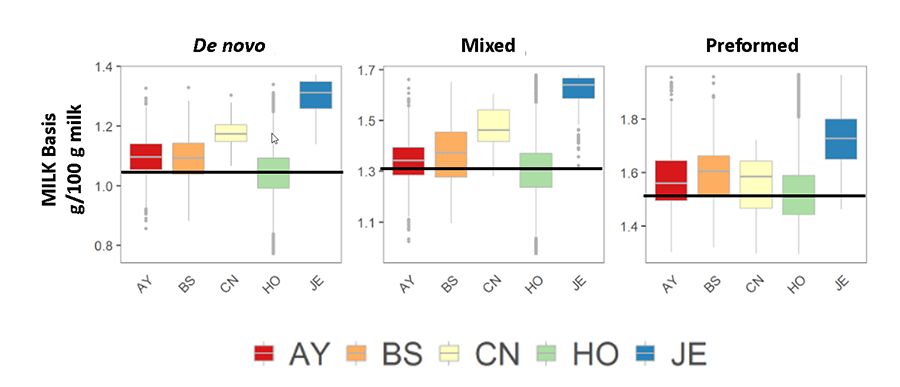
High performance herds have average levels of de novo fatty acids
There is a common misconception that it is “normal” for high performance herds to have below-average de novo levels, due to a dilution effect related to above-average milk production. This is partly true, but the difference between high performance herds and average herds is minimal. To demonstrate this, Figure 3 shows the distribution of the fatty acid profiles of 3 300 conventional Holstein herds. The herds are categorized by annual production; the red box represents the herds in the bottom 10% for production, the orange box represents the herds that rank between the 10th and 80th percentile (26.6-37.9 kg of milk/cow/day), the green box represents the herds in the top 10% (37.9-40.7 kg of milk), and the blue box represents the top 2% of herds (over 40.7 kg of milk/cow/day). As the values below the graph indicate, the “blue” herds seem to have lower levels of de novo fatty acids in their milk, but the difference is about 0.01 g/100 g of milk on average, which is very close to the average presented in the PROFILab report.
Figure 3: High producing herds (kg/cow/day) make as many de novo fatty acids as the average herd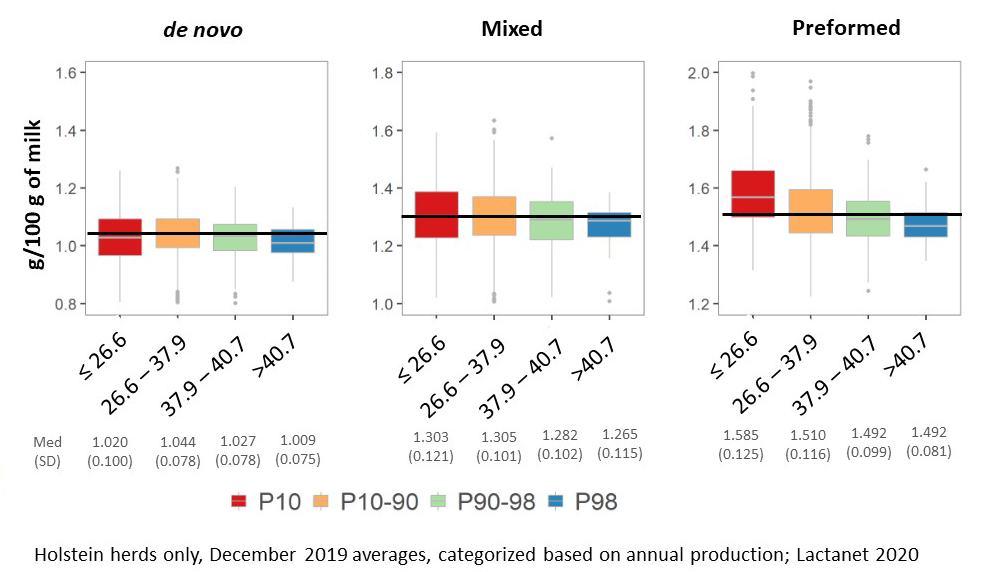
If we repeat the exercise but categorize the herds according to their production in kg of fat/cow/day, the result is the same: the best herds have average de novo fatty acid contents (Figure 4). This graph shows that the variation between herds within a same production category is greater than the variation between the different categories. We are currently conducting a study of 100 Quebec herds to gain a better understanding of the factors behind this high variability, specifically those related to feeding, herd management and environment.
Figure 4: High fat producing herds (kg/cow/day) make as many de novo fatty acids as the average herd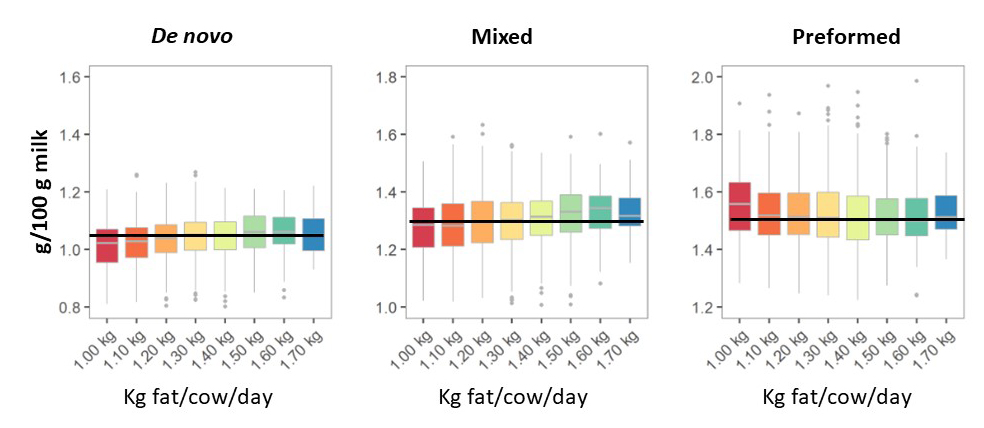
How to interpret the boxplot?
A boxplot illustrates the variation within a group of data, in this case a group of herds. In the example below, the blue box represents 50% of herds, that is, all the herds that are “in the middle” of the group. The vertical lines extending below and above the box indicate the herds with the highest and lowest values.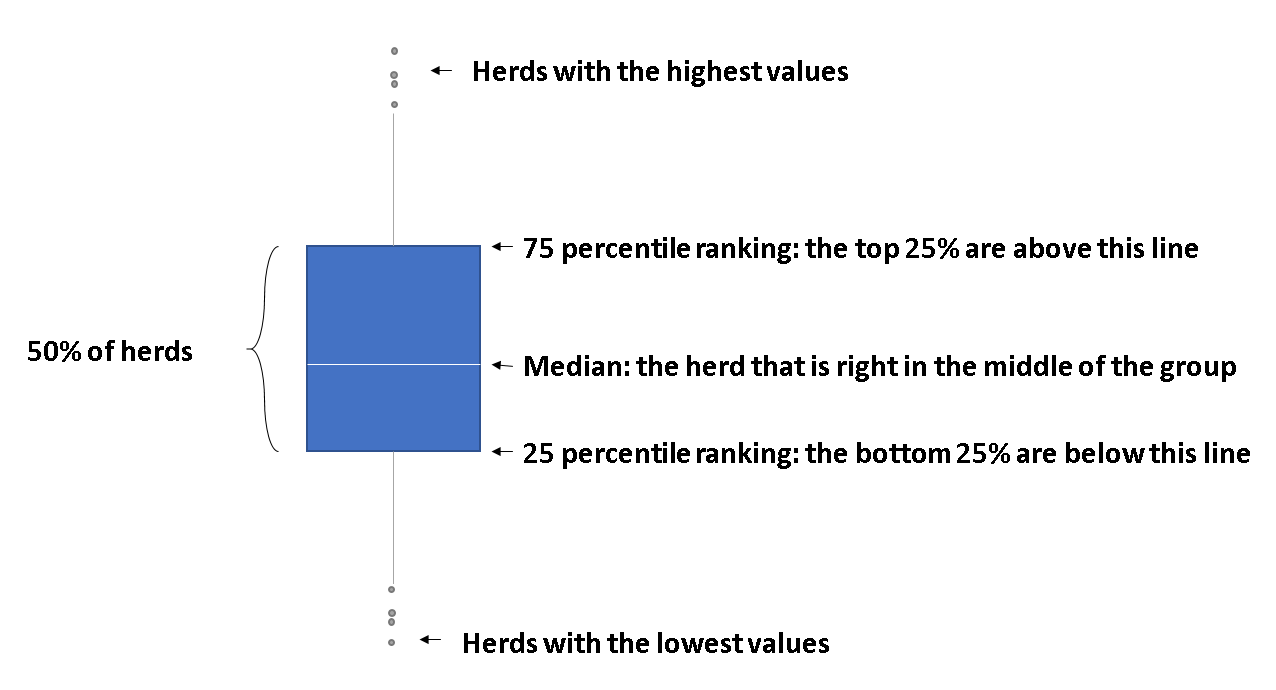
The bulk tank fatty acid profile has proven to be very useful for several producers to optimize feeding and herd management, or to get a better understanding of cow metabolism and performance. We will gain a more accurate understanding of this indicator as we use it more. It will undoubtedly become very interesting to use the fatty acid profile to predict a change in component levels, before the fat or protein levels actually change.
As an example, Figure 5 presents the profile of a herd in the summer of 2019, where we see that there were significant changes in the fatty acid profile in July and August. The first changes occurred in early July when body fat reserves were mobilized after a breakdown in the feeding equipment. The second change, on August 5, had a major impact on the fatty acid profile but didn’t affect fat and protein levels. Later in August, a change of the same magnitude as in July, but longer lasting, lead to an upheaval of the components and a drop in protein levels, which took several weeks to return to normal. Would this decline been avoided with PROFILab? Perhaps, or it might have lessened the impact.
Figure 5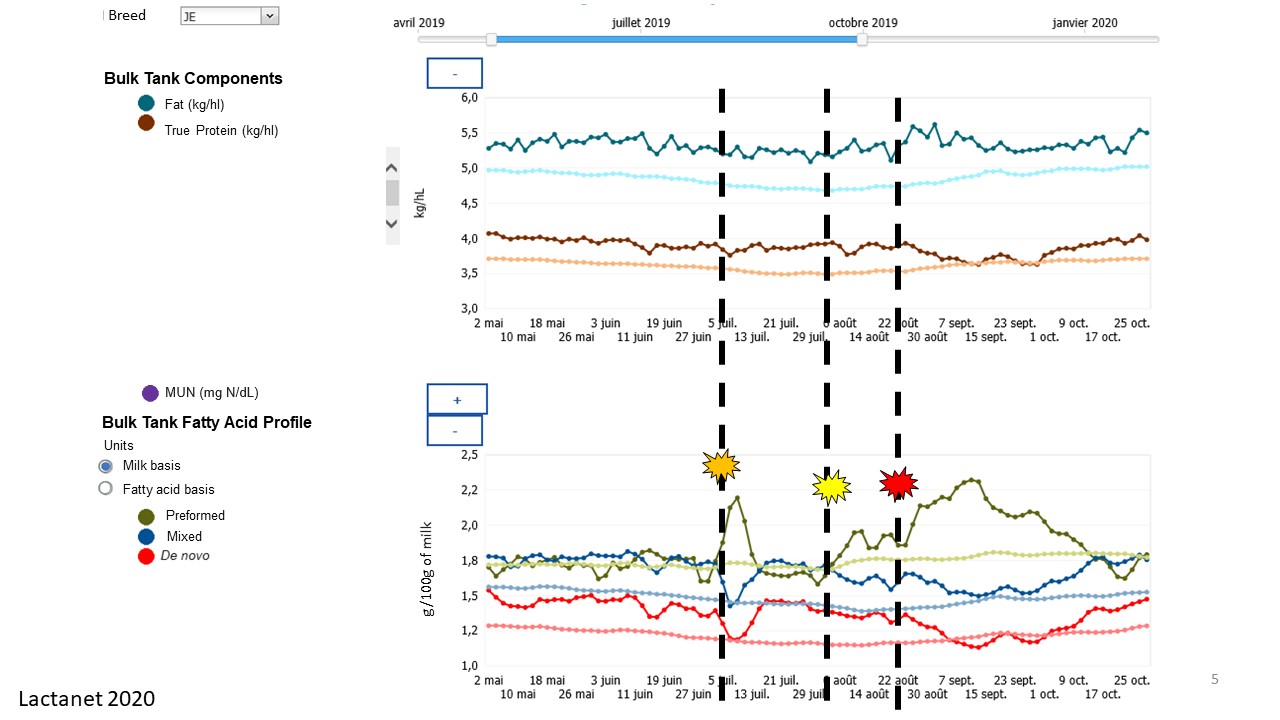
Upcoming projects include a warning system indicating changes in the fatty acid profile that will enable producers and their service providers to react more quickly and prevent disastrous effects, and incorporating new and powerful analytical techniques such as machine learning. Also on the radar: predicting feed efficiency and methane production for lactating cows, and identifying biomarkers to certify grass-fed dairy herds. Stay tuned…
At the same time, the rumen and the mammary gland are still adapting to lactation, and de novo fatty acids (synthesized in the mammary gland) are not being used to the full. Mixed fatty acids, a combination of the two previous sources, generally follow de novo fatty acids in early lactation. Based on the data that we’ve collected in the past few weeks in Quebec, and consistent with what’s being seen in other parts of the world, most of the changes in the fatty acid profile seem to occur within the first 75 days of lactation, with the proportions stabilizing thereafter (Figure 6).
Figure 6: Milk fat composition is influenced by stage of lactation
It is clear that the changes in the different groups of fatty acids for cows in early lactation contain a great deal of valuable information, which can be used to ensure a successful transition and improve performance in our herds. Here are some specific examples:
- Evaluate the mobilisation of body fat reserves
Cows in early lactation have a negative energy balance and very often use the energy stored in their body fat reserves to meet the extremely high demand for nutrients required to produce milk. Although this is a natural and well-known phenomenon, it is often difficult to estimate the extent of the mobilisation. The milk fatty acid profile can be used for that purpose. Moreover, in combination with the analysis of ketone bodies in milk (including β-hydroxybutyrate [BHB] measured by Ketolab or blood tests), the milk fatty acid profile could provide greater insight into how cows manage this high demand for nutrients at the start of lactation, enabling producers to apply corrective measures to herd management and feeding during the transition period, as necessary. - Estimate weight loss in cows
As described in the section above, cows in early lactation mobilize body fat reserves, increasing the proportion of preformed fatty acids in the milk. By combining the composition of the different fatty acids and groups of fatty acids with other components such as total fat and BHB, it is possible to predict how much weight a cow will lose and respond appropriately to avoid excessive mobilisation that would diminish a cow’s reproductive performance and potentially reduce longevity in the herd. - Assess the risk of ruminal acidosis
Measuring something that isn’t visible to the naked eye, such as rumen pH for example, is definitely a way to use the milk fatty acid profile to benefit. This application is currently being validated through a joint project with researchers from Agrinova and Université Laval. If it proves possible to accurately predict rumen pH with the fatty acid analysis, it will then be possible to use the profile to assess the risk of acidosis, and possibly prevent more serious consequences by optimizing transition management, particularly for cows in early lactation.