SNF ratio, why and how?
- June 21, 2022
- Le Producteur de Lait Québécois Magazine
The demand for fat and protein is very strong. This is not the case for lactose. The lactose content of milk varies very little. To decrease the lactose production (in tons per year), you have to deliver a milk rich in fat first and then in protein. We will focus here on the fat content since it has the most influence in the SNF ratio calculation equation.
This article will not address in depth all the factors that influence the fat test of your herd. Ventilation, feeder space, water availability, feeding sequence, sorting, etc. are only a few of the many factors that can explain a fat test below expectations. We will limit ourselves to four technical parameters that are easy to measure and that can have important consequences on the results.
1. Genetics
The importance of genetics is undeniable. It is well understood today. The heritability for this trait is among the highest, around 50%. This means that it is an easy trait to improve compared to other traits such as conformation. In other words, a cow with a fat index of -0.50% mated to a bull with +0.50% will produce a daughter with a genetic index close to the national average.
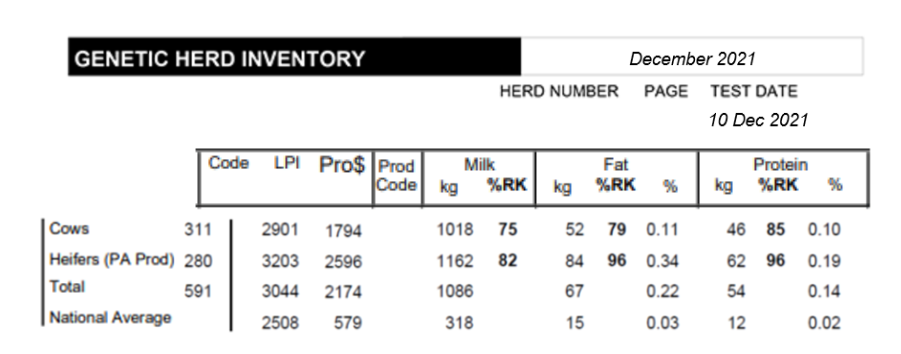
Knowing the genetic potential of the animals in your herd is of utmost importance. Strong genetics do not guarantee high butterfat in milk because there are many other factors involved. However, a herd with a genetic index of, say, -0.20% does not have what it takes to easily achieve a fat test of 4.0 kg/hl and better. This is not the case for the herd reported in Table 1. Its fat index (+0.11%) is well above the national average (+0.03%).
Table 1. Extract from the Genetic Inventory Report of a herd with a strong genetic background
Over the years, tools have been developed to help producers improve their control over the genetic development of their herd. Among these is the Compass application developed jointly by Holstein Canada and Lactanet.
Figures 1 and 2 show extracts for two herds. Which of the two herds do you think is in a better position to maintain an SNF ratio close to market needs? Herd A, of course. The deviation for fat of its recorded subjects since 2016 (blue line) exceeds the 90-percentile rank for the breed. Herd B is now working on it. They are encouraged to continue.
Figure 1. Deviation for fat over time in herd A
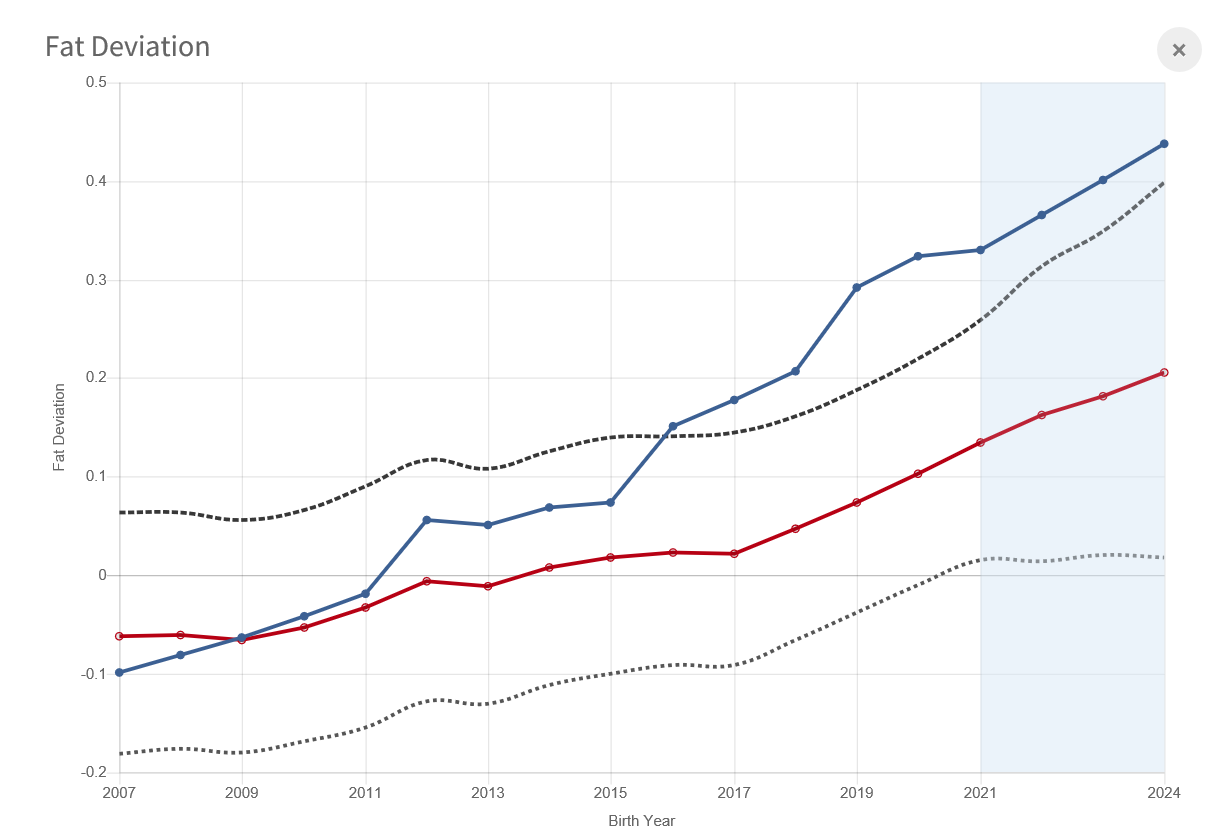
Red line: national average
Figure 2. Deviation for fat over time in herd B

Red line: national average
2. Dry Matter Consumption in Forages
Since the cow is a ruminant, forage is the basis of her diet. A mixed ration (forages and concentrates) allows our cow to withstand higher production than just the need to feed her calf. We must go back to the basics. Forage is essential for rumination. Rumination is essential to the health of the microbial flora. The rumen microbial flora is essential to the cow’s role on our planet, including the digestion of cellulose and hemicellulose to produce nutrients useful to humans. Most people are now familiar with PROFILab.
De novo fatty acids, measured in every milk sample in the tank, are the very thing that allows you to judge the ruminal health of your cows.
We offer a simple way to evaluate the dry matter consumption in forages, i.e., kilograms per cow per day. That’s all it takes. No complicated equations.
You will understand that for farms that handle chopped silage (vertical silos, horizontal silos, grinders, etc.), you will need the dry matter of the silage (moisture testers required).
For rations that include large bale silage (round or rectangular), we have a tool to calculate the weight of the bale in kilograms of dry matter. All you need is the bale size, the number of knives on the baler, the number of bales fed to lactating cows per week and the number of lactating cows.
Table 2. Examples of forage dry matter consumption calculation for a farm with chopped silage
| Feed | % dry matter | kg per day | kg dry matter |
| Silage 1st cut | 40 % | 15 kg | 6.0 kg |
| Corn silage | 35 % | 20 kg | 7.0 kg |
| Hay | 90 % | 1 kg | 0.9 kg |
| Total | 36 kg | 13.9 kg |
Producers who attended the Lactanet workshop on milk fat (The Magic of a Milk Fat test) last winter will remember that the target values (kg/day/cow) vary according to breed: 16 kg and more for Holsteins, 15 kg and more for Ayrshires, 18 kg for Brown Swiss, 13 kg and more for Jerseys and Canadian. The more corn silage we have in our ration, the higher the target quantity.
If the dry matter consumption in forages is lower than the target values, the causes must be sought. The list is long. There is the quality and conservation of the forages, the management of the feeder, the sequence of the meals, the level of salt in the ration, etc. It is not always easy to find, but you should not stop looking until you have found the cause.
3. Effective Fibre
4. Milk/Concentrate Ratio
Another useful technical parameter to optimize your fat test is the milk/concentrate ratio. It is easy to calculate and gives a sounding board on several questions: well-balanced ration? Forage quality? Correct quantities of concentrates? Just to name a few.
In the Lactanet database, the milk to concentrate ratio has hovered around 3.30/1.0 since the winter of 2010-2011. The R farm profile (Table 3) is not the one we want. A ratio of 2.44 is too low. Now we have to investigate what could be the causes. In this case and at the time of the visit to the farm, the dry matter consumption in forages was 12.3 kg and we remember that for Holsteins, we must aim for 16 kg.
Table 3. Calculation of the milk/concentrate ratio for farm R
| Milk delivered (litres per day) | 2,412 liters |
| Barley in the TMR (kg/day) Mineral in the TMR (kg/day) Robot feed (kg/day) | 272 kg 12 kg 704 kg |
| Total concentrates (kg/day) | 988 kg |
| Milk/concentrate ratio | 2.44 liters/kg |
There are many challenges in dairy production. From drought to input prices, the list goes on and on. The SNF ratio is another, but there are many tools to keep track of it. Don’t forget that Lactanet is there to help you meet the needs of the market as best as possible, the key to the most profitable dairy production.
Action Plan for a Profitable Fat Test:
- Read the Genetic Herd Inventory report to know its genetic index for fat
- Use Compass to track the evolution of your genetic index for fat
- Calculate your forage dry matter consumption
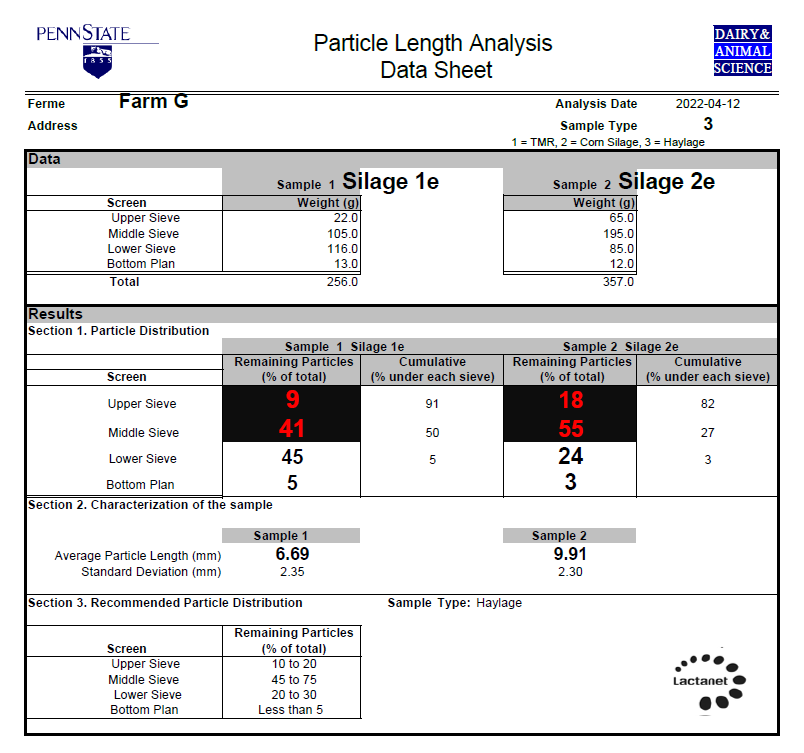
- Use particle separators (e.g., Penn State) on a regular basis to determine the effective fibre of your forages – particles from the first two plates
- Calculate your milk/concentrate ratio
- Be aware of other factors that may influence the fat test – e.g., ventilation, feeder space, water availability, feeding sequence, sorting, etc.
- Do not hesitate to ask your technician or Lactanet advisor for help
Share