Now you can compare with the best robot farms!
- February 25, 2020
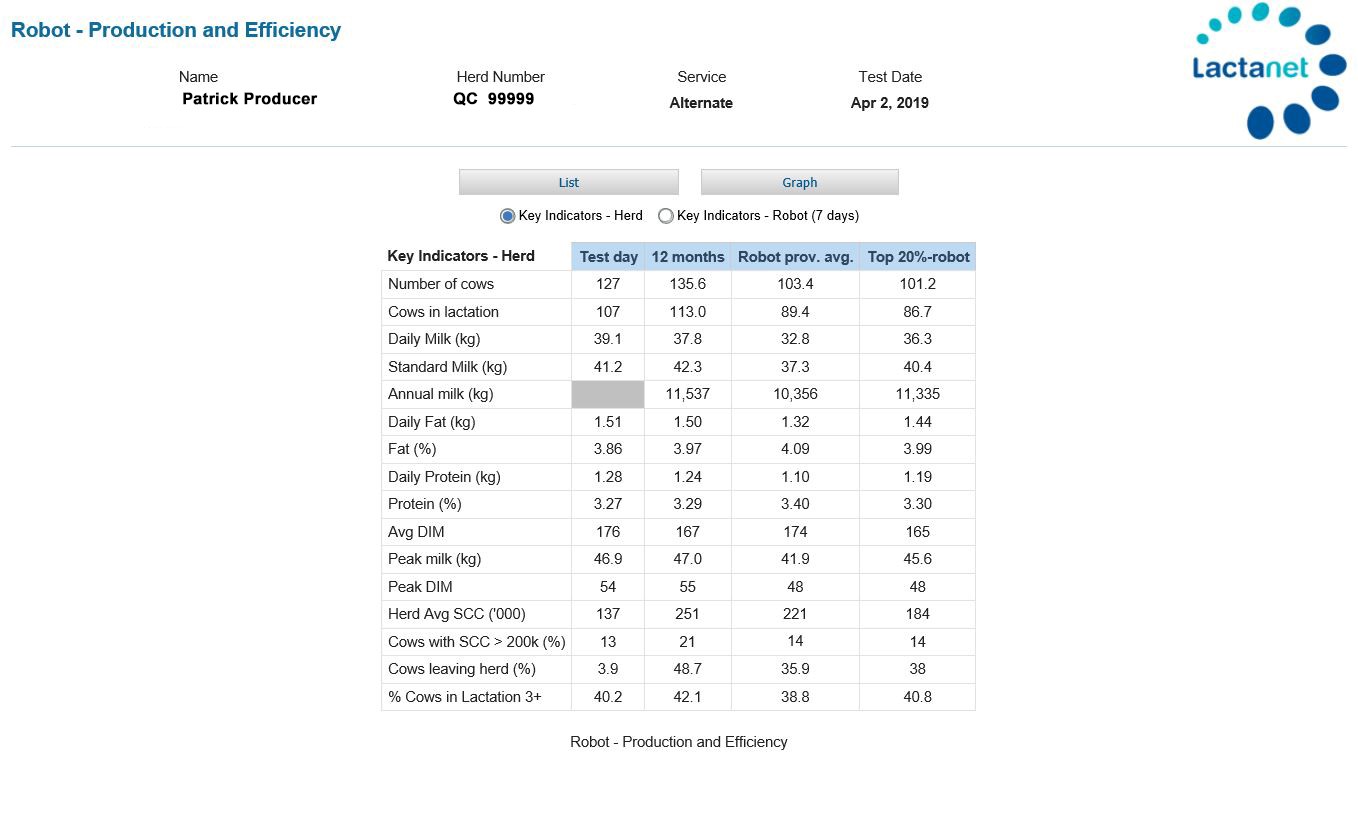
Dairy producers with robot milking systems have access to our interactive Robot– Production and Efficiency report. One of the things that this new report can do is display the provincial average, according to main breed, for the key indicators related to robot milking. An additional column also provides the average for the farms in the top 20% group, by fat production per robot (table 1).
How do the best stand out?
They average 20% more milk and fat!
The top 20% group is made up of the best farms according to quantity of fat produced per robot, not the top 20% for each of the key indicators. Dairy producers in this elite group produce, on average, 20% more milk and fat than the provincial average. This production gain per robot is due to an 11% increase in milk productivity per cow combined with 8% more cows per robot.
Table 1. Key Robot Milking Indicators for Holsteins using the new interactive “Robot– Production and Efficiency” report
A Good Turnout at the Robot
We might think that on the farms in the top 20%, the robot would have a tendency to be more occupied and the number of milkings per cow per day would drop. In fact, this is not the case. The number of milkings per cow is actually slightly higher. This allows the farm to maintain a good turnout at the robot and sustain the production increase. Refusals are indeed a little lower, but so little that we can still observe the cows’ willingness to go to the robot.
Less Failures and Incomplete Milkings
Failure to milk and incomplete milkings waste time because they are milkings that need to be repeated. It is also not surprising to see that this indicator is lower for the best herds. The provincial average and top 20% columns show the average value for this indicator, all manufacturers combined. We do know, however, that the definition and objectives for milking failures and incomplete milkings can vary according to the manufacturer. A line below the table shows the average for any manufacturers for which we have sufficient data from a statistical point of view.
Improved Milking Efficiency
The robot report provides four new indicators for measuring robot milking efficiency. These indicators, shown with an asterisk in table 1, are calculated values. Given the decrease in average time per milking, it is not surprising to see the robot has an 11% increase in efficiency (kg of milk/minute) on farms in the top 20%. The maximum quantity of milk that can be produced when the robot is full (10% free time) is also 11% higher.
To find out more about these new efficiency indicators, watch for this article.
$233 More per Robot per Day!
The top 20% group also does well from a profitability point of view, with gains in milk value of $233 per robot per day. This represents a positive difference of 18.5% as compared to the provincial average and most importantly, gains of $85,000 per robot per year!

